


Which customers contribute most to the business? Where is revenue growing while profitability is weakening? Which products and channels deserve a closer look?
Banks and fintech companies hold much of the information needed to explore these questions. The challenge is connecting revenue, expenses and customer context into a consistent financial story that leadership and customer teams can use.
The first step toward customer intelligence is understanding the economics of the relationship.
This blueprint draws on NorthBay’s banking delivery experience to show how a Snowflake foundation can support financial dashboards, customer-level analysis and a next layer of conversational intelligence.
1. Start with the economics of the customer relationship
A banking relationship can generate income across several products while incurring costs in different systems. A revenue total tells only part of that story. Leaders also need to understand the expense base, the period being measured and the customer or product to which each entry belongs.
For fintech companies, the same question appears in a different operating model: how do product revenue and attributable costs combine at the customer or segment level? The useful starting point is a shared financial view that business teams can explain.
2. A banking implementation, translated into a reusable blueprint
In a banking engagement, NorthBay built executive and Customer 360 dashboards around revenue and expense datasets. The solution connected file-based data in Amazon S3 to a layered Snowflake architecture, using Amazon QuickSight for visual analysis and Snowflake Intelligence for conversational analytics.
The same architectural approach can extend to diverse data sources, including operational databases, enterprise applications, APIs, cloud storage and event streams. Depending on the source and integration pattern, data can be ingested through batch loads, change data capture or streaming pipelines, with refresh frequency aligned to business needs.
The analytics layer also supports a choice of BI tools. Amazon QuickSight was used in this engagement; organizations can use Microsoft Power BI, Tableau and other compatible tools to consume Snowflake data, while keeping shared business definitions in the underlying analytical models.
The executive view brought together revenue and profitability trends, including interest income, fee income and total revenue. The customer view exposed revenue and expense activity, transaction count and volume trends, and a customer profitability timeline.
The practical starting point: connect financial records at customer level, make the definitions reusable, and give leadership and customer teams complementary views of the same underlying data.
The delivery pattern below draws on that work. Client identity and identifying details have been removed; the dashboard illustrations use synthetic data.
3. Build the financial data foundation in layers
In the banking engagement, the architecture started with revenue and expense extracts landing in Amazon S3. Snowflake organizes the data into Bronze, Silver and Gold layers, with managed tasks coordinating the processing steps. Separating these responsibilities makes it easier to trace a reported figure back to its source.
Choose the ingestion pattern that fits the source
Snowflake can receive data from operational databases, enterprise applications, APIs, cloud storage and event streams through supported connectors, integration services or custom pipelines. The right approach depends on source capabilities, data volume and how quickly the business needs the information.
These patterns can coexist within the same platform. Choose the pattern for each dataset, then standardize quality and business definitions in the downstream layers. Snowflake data loading overview ↗
Useful quality checks include duplicate financial entries, missing customer keys, unmapped product codes, inconsistent signs and unexpected currency values. Exceptions should be visible to the people responsible for resolving them.
Snowflake Tasks can schedule processing or run in response to supported events. Refresh frequency should be designed around source availability and the business reporting window. Ingestion and downstream processing should be designed together to meet the required data freshness. Snowflake Tasks documentation ↗
4. Give leaders a connected view of financial performance
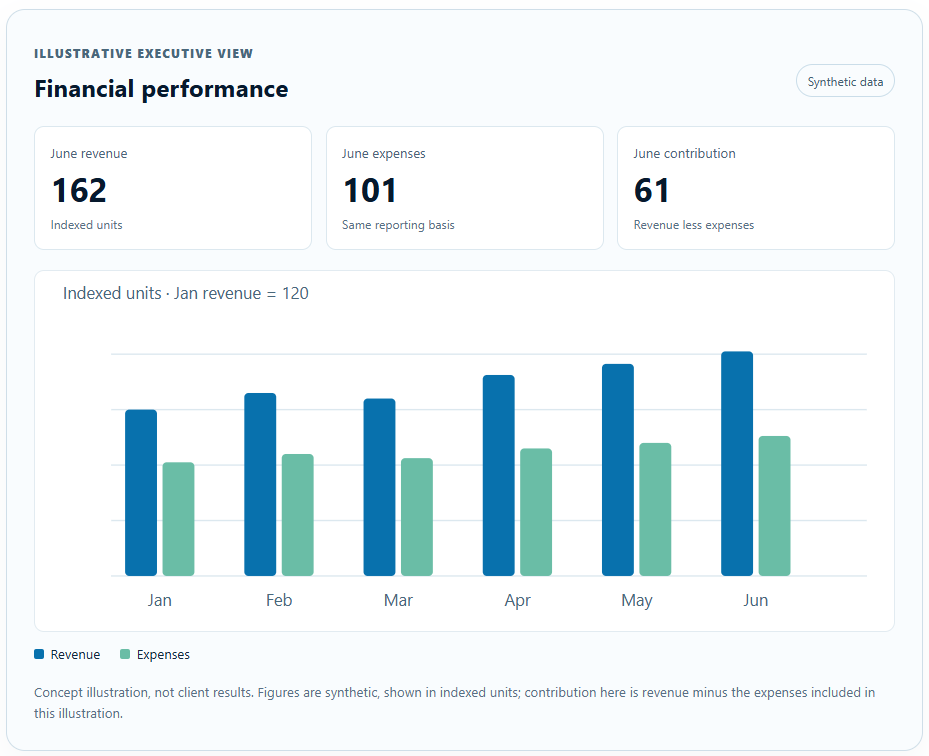
The executive dashboard organizes the financial story around revenue, expenses and profitability over time. Business breakdowns—such as product, branch, income type and currency—help leaders move from the headline trend to the area that deserves attention.
Amazon QuickSight is one of many BI tools that can connect to Snowflake. Microsoft Power BI, Tableau and other compatible tools can present the same governed financial models, allowing teams to use the reporting experience that fits their needs. Keep common metric definitions in reusable data models so the financial story remains consistent across tools. Snowflake partner and technology ecosystem ↗
A decline in contribution might reflect a revenue change, a cost change or a shift in product mix. Showing those measures together provides a more useful starting point for investigation than reviewing separate reports.
The model should preserve currency context. Comparing native-currency amounts is different from reporting consolidated performance: consolidated measures need an agreed exchange-rate source, conversion date and reporting currency.
5. Make customer profitability visible over time
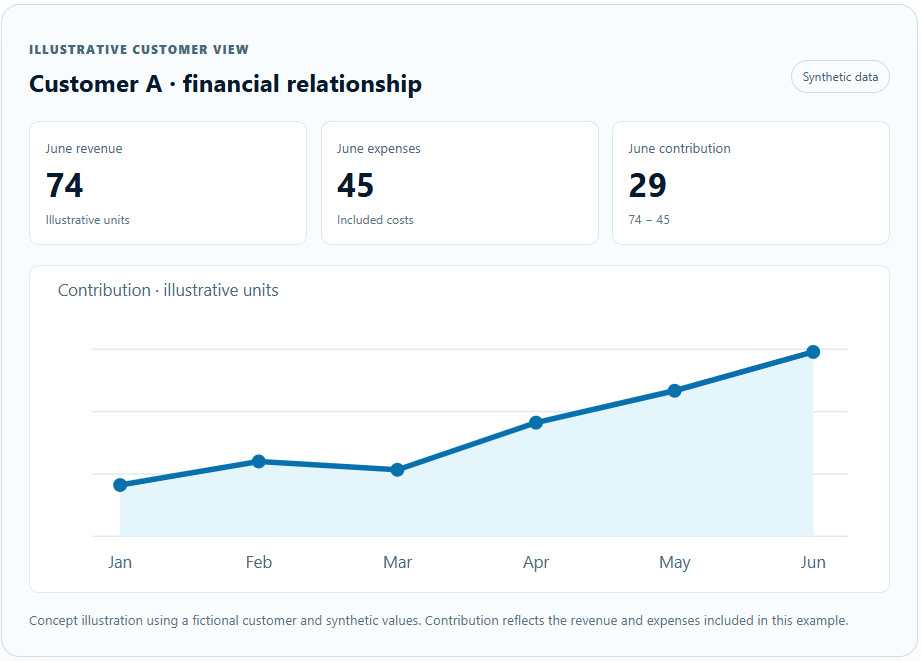
The Customer 360 view brings the financial relationship into focus: revenue, expenses, recorded activity and the way contribution changes over time. This helps customer teams ask better questions about a relationship before deciding on an action.
A useful starting scope is the customer’s footprint in revenue and expense records. Transaction counts in this context describe those records; they should not be confused with a complete history of deposits, withdrawals or payment activity.
For broader customer coverage, the foundation can be extended with account holdings, balances, relationship history and verified customer identifiers across systems. Each additional source should answer a clear business question and bring its own quality and access requirements.
6. Read product and channel signals in context
Financial product descriptions can reveal useful channel-linked patterns. For example, revenue items associated with ATM or internet banking activity can help teams explore how recorded income is distributed across services.
Those signals have a defined boundary. Channel-linked revenue is not the same as login frequency, active digital users or engagement across a mobile application. Those questions require direct channel and usage data.
For banks: start with the financial relationship across products and branches.
For fintech companies: apply the same modeling pattern to the relevant customer, product and cost records. Add behavioral data where a usage question requires it.
7. Make trust part of every layer
Customer-level financial information needs a deliberate access model. Design permissions around business roles and intended use, with controls for sensitive fields and the level of detail each audience should see.
Work with the institution’s security, governance and risk teams to define the controls required for its environment and validate their operation.
8. Add conversational analytics to the trusted foundation
Once customer and financial measures have clear definitions, natural-language analytics becomes a useful additional way to explore them. The banking solution included Snowflake Intelligence alongside the dashboard experience; the architectural principle is to ground conversational questions in the same business meaning used for reporting.
Snowflake semantic views define business concepts, relationships, dimensions and metrics. That semantic layer helps supported AI tools interpret a business question in the context of the data. Semantic views documentation ↗
The analytics experience should make the reporting period, filters and metric definitions clear. Test representative questions against known answers, and retain human review when interpreting findings or deciding what action to take.
The analytics experience should make the reporting period, filters and metric definitions clear. Test representative questions against known answers, and retain human review when interpreting findings or deciding what action to take.
9. Expand from financial visibility to richer intelligence
The architecture provides a practical sequence for extending value. Start with the financial questions supported by the available records, then add the data and operating capabilities needed for the next decision.
The later stages are opportunities to extend the foundation. They should be prioritized and validated on their own merits, with success criteria that fit the institution.
Five design choices that make the difference
- 1
Define profitability before presenting it
Document included income, expenses and allocation rules. Distinguish recorded contribution from a fully allocated profitability measure. - 2
Keep financial activity and customer behavior distinct
Revenue entries can support financial analysis. Broader engagement claims need direct behavioral data. - 3
Build one reusable business model
Keep shared definitions in the analytical foundation so dashboards and conversational interfaces can align. - 4
Design for reconciliation
Preserve source context and make failed checks visible. Traceability is essential when a number is challenged. - 5
Add AI with a clear question set
Start with bounded financial questions that can be checked against known results, then expand coverage deliberately.
FAQs
About NorthBay Solutions
NorthBay Solutions is a leading provider of cutting-edge technology solutions, specializing in Agentic AI, Generative AI MSP, Generative AI, Cloud Migration, ML/AI, Data Lakes and Analytics, and Managed Services. As an AWS Premier Partner, we leverage the power of the cloud to deliver innovative and scalable solutions to clients across various industries, including Healthcare, Fintech, Logistics, Manufacturing, Retail, and Education.
Our commitment to AWS extends to our partnerships with industry-leading companies like CloudRail-IIOT, RiverMeadow, and Snowflake. These collaborations enable us to offer comprehensive and tailored solutions that seamlessly integrate with AWS services, providing our clients with the best possible value and flexibility.
With a global footprint spanning the NAMER (US & Canada), MEA (Kuwait, Qatar, UAE, KSA & Africa), Turkey, APAC (including Indonesia, Singapore, and Hong Kong), NorthBay Solutions is committed to providing exceptional service and support to businesses worldwide.